Conversational analytics dashboard
Ask questions about your audit logs in plain language and get interactive charts back.
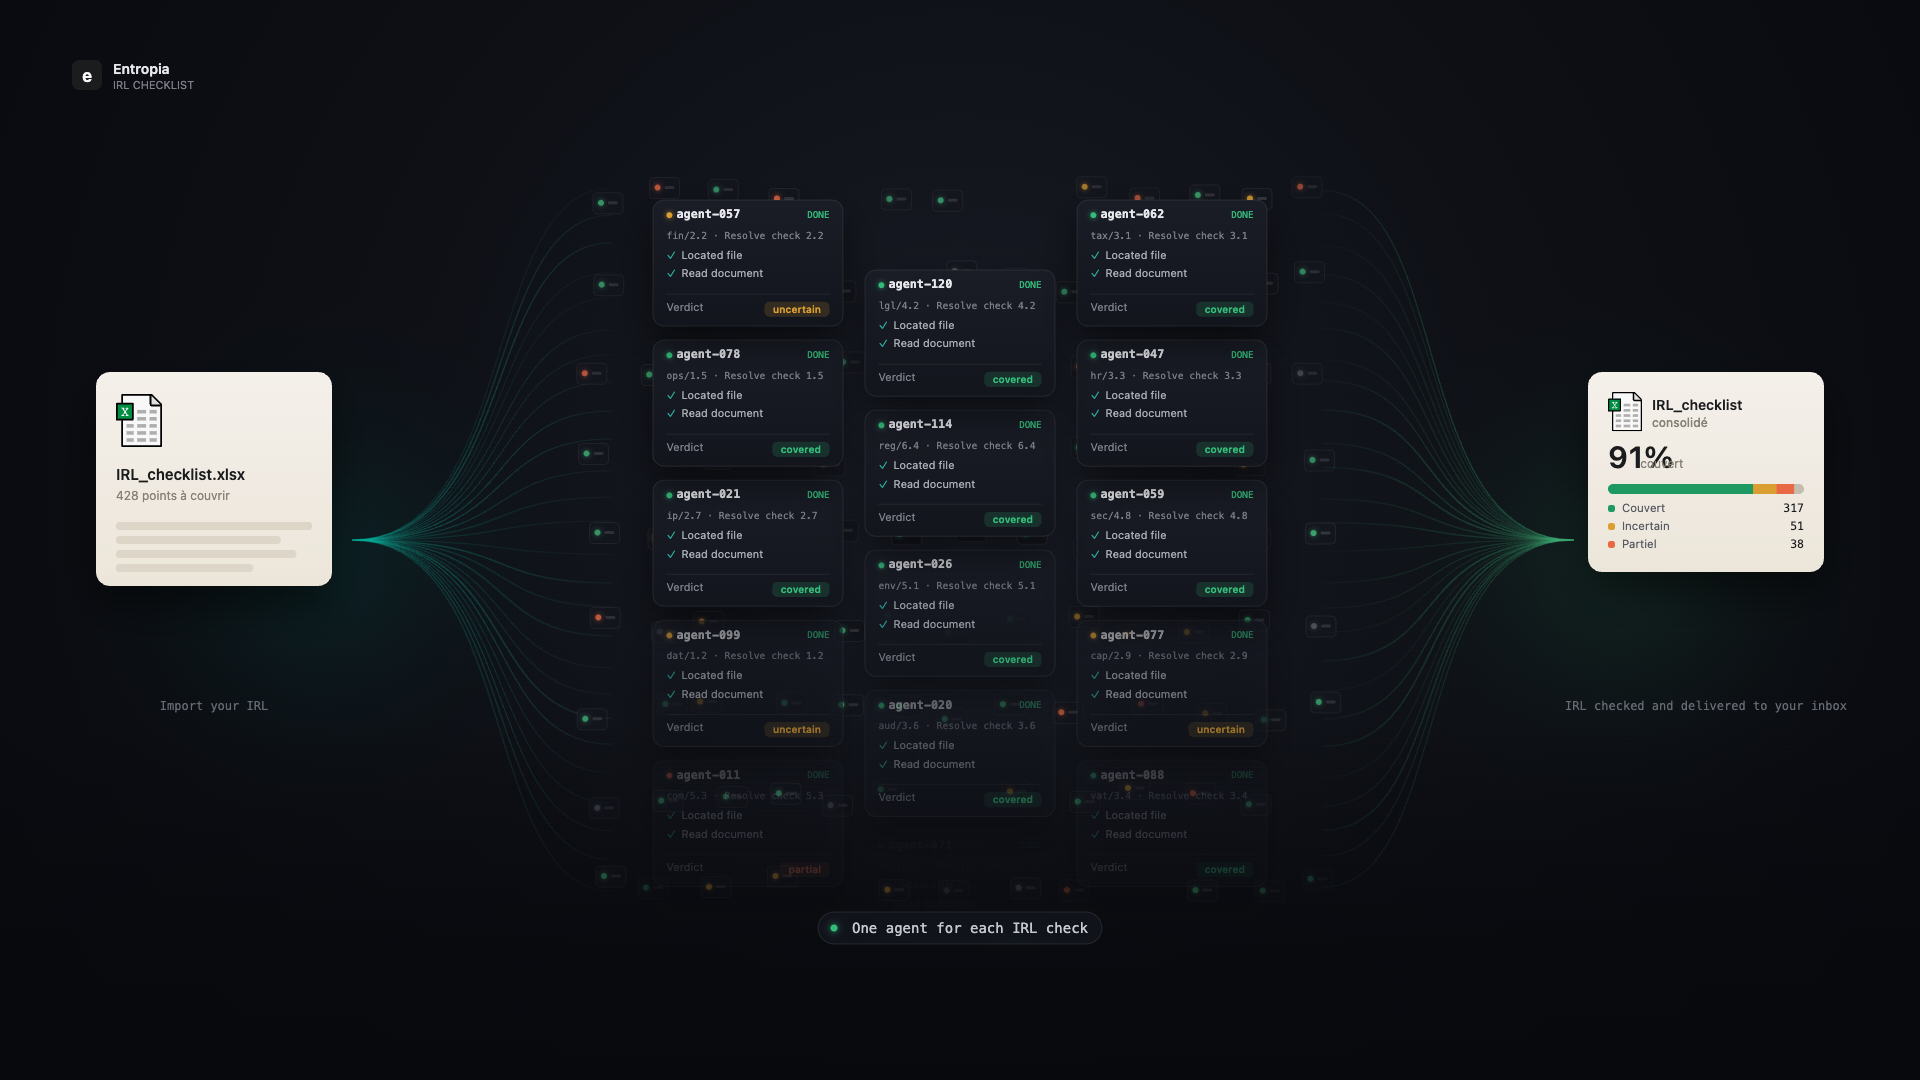
Ask your audit log a question in plain language and get the answer as an interactive chart. "Which groups were most active last week?" or "How many documents did this bidder open?" no longer need a manual export and a spreadsheet.
The data room already records every event; this turns that record into something you can interrogate directly and read at a glance.