New engagement dashboard
Every action in the data room was already logged. The logs now come with a dashboard on top: activity, coverage and a group-by-group leaderboard.
The activity log has always held the answer to the question every seller asks halfway through a process: which bidders are actually doing the work. Getting the answer out of it meant exporting to Excel and building the view yourself, or asking Scout for it. Both work. Neither gives you something to glance at on a Monday morning.
The engagement dashboard sits on top of the same logs and shows the shape of the process straight away.
The data room at a glance
Total activity for the period and how it compares with the previous week. How many participant groups have been active in the last seven days. The ratio of views to downloads. Data room coverage, meaning how much of the documentation has actually been opened, as a share of the files in the data room. When the last thing happened.
Below that, a weekly trend broken down by views, downloads and Q&A activity, so you can see when a bidder started reading in earnest, and when they stopped.
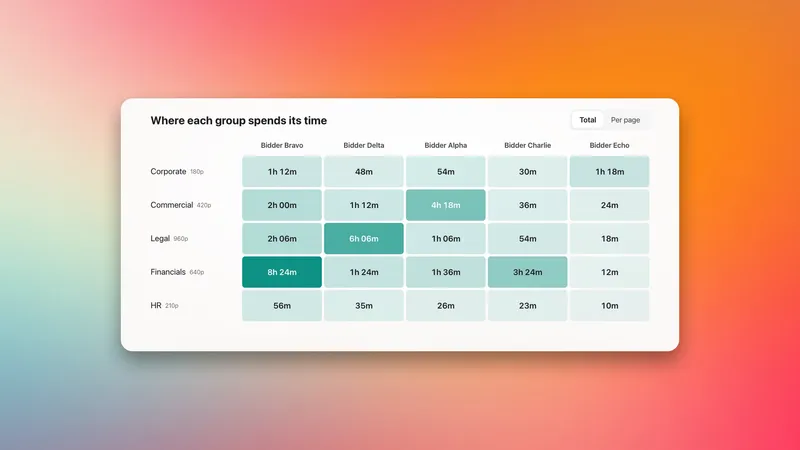
Group by group
The participant group leaderboard puts every group side by side: events, how many people in the group are behind them, its own view to download ratio, its own data room coverage, and when it was last active. Click a group to filter the activity log underneath it.
That table is where the process reads clearly. A group with high coverage and a low download ratio is reading carefully. A group at zero coverage two weeks in is not preparing an offer.
Ask, from wherever you work
The dashboard is a starting point, not a ceiling. Ask it to explain a participant's story and it walks you through what that group has done and what it suggests. You can still query the raw logs with Scout, or from your own connected AI platform, and you can still export everything to Excel.